
14. Linear Regression#
The base of all model fitting is fitting a line to data. If you understand this, you can understand everything else.
For the following examples, we will use the following data:
x = np.array([0.65, 0.60, 0.41, 0.02, 0.94, 0.67, 0.84, 0.10, 0.23, 0.59])
y = np.array([6.52, 6.54, 5.82, 4.52, 7.55, 6.54 , 7.03, 4.97, 5.22, 6.47])
15. Linear Regression#
slope, intercept, r_value, p_value, std_err = stats.linregress(x,y)
https://docs.scipy.org/doc/scipy/reference/generated/scipy.stats.linregress.html
np.polynomial.polynomial.polyfit(x, y, deg, rcond=None, full=False, w=None)
https://numpy.org/doc/stable/reference/generated/numpy.polynomial.polynomial.polyfit.html
Note
You can use the weights in polyfit, but you likely want to do a \(\chi^2\) annalyis. Also notice that the weights are w[i] = 1/sigma_y[i].
15.1. Ordinary Least Squares (OLS)#
multiple independent parameters.
https://www.statsmodels.org/stable/examples/notebooks/generated/ols.html
assumes null hypothesis of m=0
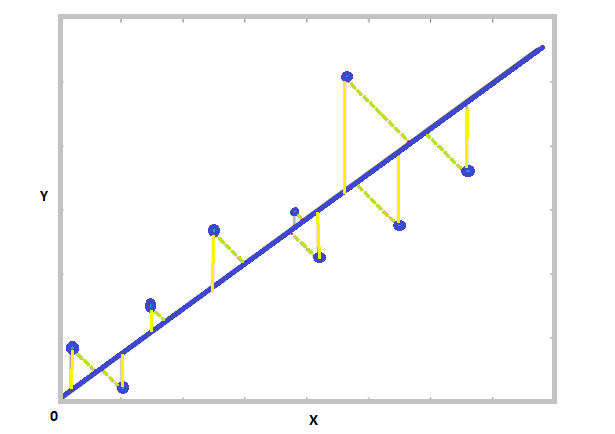
looks at delta-y. NOT perpendicular to slope.
See example on p.137 (figure 6.2) of Wall
15.2. Orthogonal Distance Regression (ODR)#
What if null hypothesis is m=1?
https://www.geeksforgeeks.org/orthogonal-distance-regression-using-scipy/
https://docs.scipy.org/doc/scipy/reference/generated/scipy.odr.ODR.html
15.3. Next time#
We often minimize a \(\chi^2\) or maximize a likelihood, how do we do this?